PASSAIC VALLEY
Algae Bloom Forecasting in a Complex Surface Water Supply System Using AI Prediction Models
Algal blooms (AB) in surface water bodies are a serious global water quality problem that pose significant risk not only to water supplies and their users but to society and the environment as a whole. AB events can cause taste and odor problems, damage the environment, and some algal classes like cyanobacteria (blue-green algae) may release toxins that can cause illness or even death in humans and animals. Treatment is expensive, and algae blooms can temporarily disrupt a critical water supply. When they occur in marine environments, they create “dead zones” that can devastate commercial fishing and render popular tourist destinations undesirable or even unsafe.
There are many examples of the destructive environmental, social, and economic impacts caused by algae blooms. In 2007, approximately two million people in China were left without drinking water for one week after their source of water, Lake Taihu, was hit by a disastrous algae bloom. In 2016, Chile lost 800 million dollars after thousands of tons of salmon were asphyxiated by an algae bloom. In 2020, 450 elephants died in the Okavango Delta in Botswana, which scientists believe was caused by a cyanobacteria bloom in their drinking water sources. Scientists blame the increasing frequency and magnitude of algae blooms on warming water temperatures caused by climate change and the increased runoff of fertilizers and organic waste into neighboring water bodies.
The modeling objective for this project was to demonstrate the feasibility of using AI as a real-time modeling and forecasting tool to accurately predict highly dynamic algae concentrations in a complex surface water supply system in response to variable water quality, biological, weather, hydrological, and water use conditions.
For the project, two types of AI models were used for predicting concentrations for three different algae species, cyanobacteria (blue-green algae), chrysophyta (gold algae) and chlorophyta (green algae).
For the first AI prediction type, AI models were developed to explicitly predict the actual algae count population. For the second AI prediction type, AI classification models were used to predict whether the algae count falls within one of four different pre-specified bins or numerical ranges. For this classification prediction problem, the following four bins or classification ranges were selected: 0 to 10 counts, 11 to 50 counts, 51 to 200 counts, and 201 and above counts. For both the AI explicit prediction and classification models, the algae count predictions were made one week and two weeks ahead.
As shown by the conceptual map, the surface water system is rather complex.
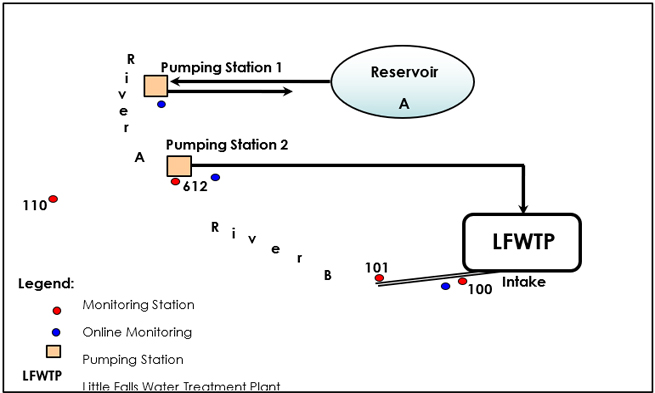
Conceptual Study Area Map. Raw Water Configuration
The system consists of two rivers and a reservoir to supply water to the water treatment plant (LFWTP). River A flows into River B upstream of the LFWTP’s intake canal, while River B water is gravity fed to the LFWTP intake by way of the canal. Rivers A and B have historically exhibited variable and unique water quality characteristics that impart different treatment challenges. River B is considered to be of lower water quality because of more numerous upstream contaminant sources. However, River A has a higher incidence of AB events. These source waters are highly variable in both quality and quantity with respect to seasonal changes and precipitation related events. Source water selection is based primarily on water quality conditions followed by economic factors such as treatment and pumping costs.
Because of their desire to forecast algae blooms and monitor overall water quality, the utility has an extensive watershed water quality monitoring program in place to assist with decision making for source water selection and prediction of water quality changes. Grab and online sample data are supplemented by United States Geological Survey flow and water quality monitoring stations located throughout the watershed.
The three-water quality monitoring or sampling stations, numbered 100, 101, and 612 shown on conceptual site plan were used in this study. Sampling Station 100 is located at the raw water intake point for the LFWTP and is representative of the water sources used to supply the treatment plant. The water source(s) entering the intake point at sampling Station 100 can at any given time originate from one or more of three possible sources; River A, River B, and Reservoir A. Water quality sampling Station 612, located at the intake for Pumping Station 2, is almost always representative of water quality on River A (in past years, some low flow extreme conditions coupled with high extractions at Pumping Station 2 captured some portion of River B for short periods). The third and last water quality sampling location, Station 101, located at the mouth of the canal that leads from River B to the LFWTP, is representative of water quality conditions on River B capturing conditions after the confluence of Rivers A and B.
A total of 302 measurement events consisting of water quality, biological, hydrologic, weather, pumping, and extraction data collected over a five-year period were used in the study. However, not all data were available in the same quantities. For example, some general water quality variables like phosphorous and nitrate were more limited. Different combinations of input variables were used for different AI models to assess prediction capability for a range of input data, foster increased system understanding, and thereby improve prediction performance.
Despite the relatively small number of data events available for learning, the AI models generally performed well during validation, achieving relatively high correlation coefficients and accurately predicting sudden and significant changes in algal populations. The models developed with both one-week and two-week ahead prediction periods accurately predicted formation and dissipation of AB events, as well as the relative increase and decrease in cell counts.
Figures 1, 2, and 3 provide a visual assessment of model performance for three representative cases. The validation figures also depict the initial algal count corresponding to the beginning of the prediction event, so that relative changes in algal counts (Final), and evaluation of AI prediction performance (ANN) is more transparent.
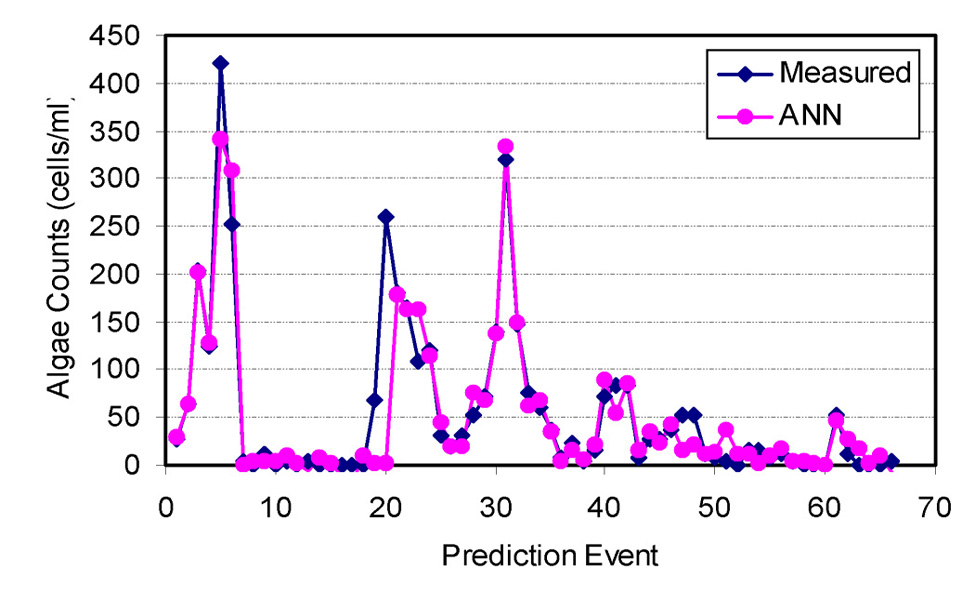
Figure 1. Time Series of Measured Chlorophyta Counts and One-Week Ahead ANN Predicted Values for a) complete data set and b) validation data set.

Figure 1. Time Series of Measured Chlorophyta Counts and One-Week Ahead ANN Predicted Values for a) complete data set and b) validation data set.
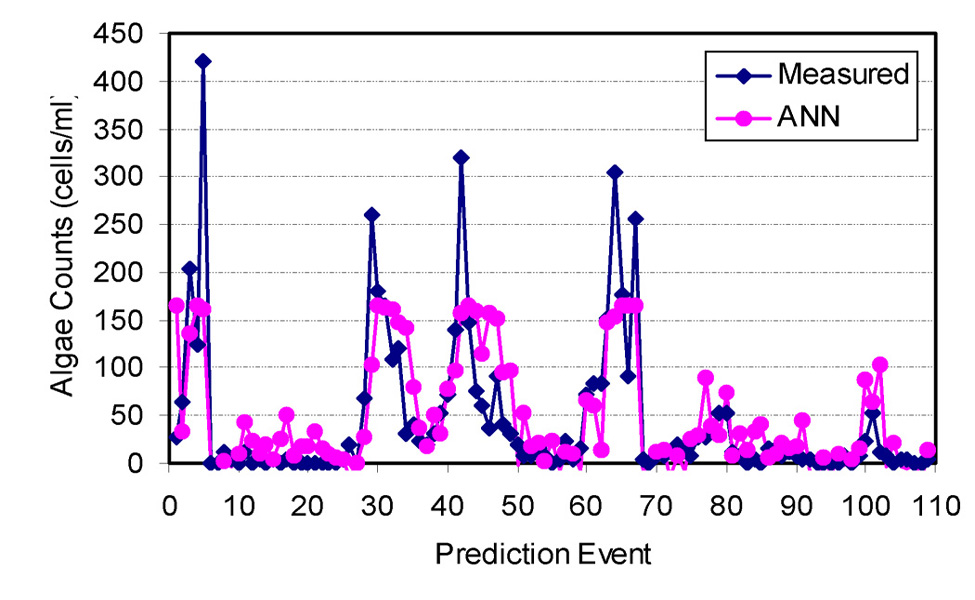
Figure 2. Time Series of Measured Chrysophyta Counts and One-Week Ahead ANN Predicted Values for a) complete data set and b) validation data set.

Figure 2. Time Series of Measured Chrysophyta Counts and One-Week Ahead ANN Predicted Values for a) complete data set and b) validation data set.
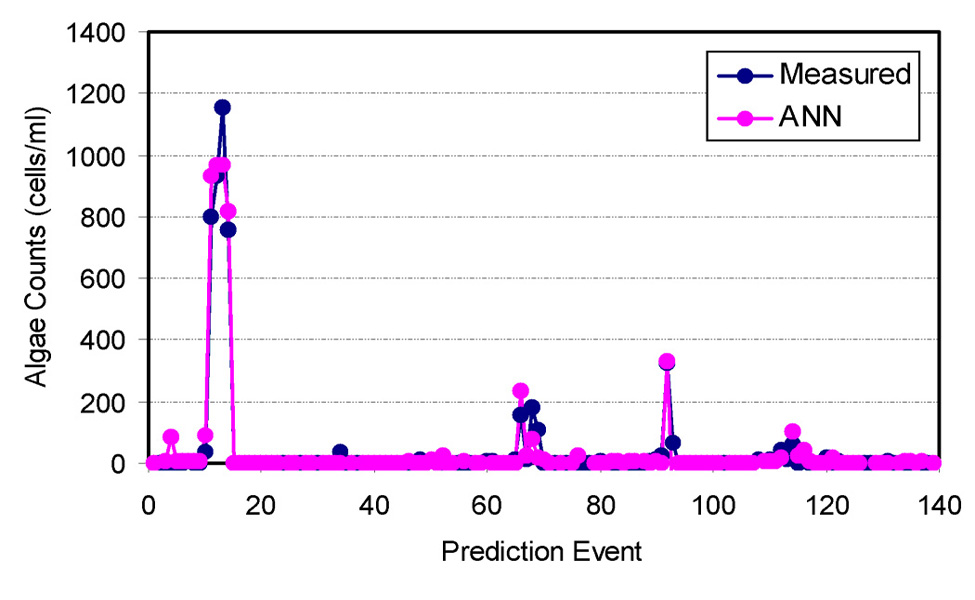
Figure 3. Time Series of Measured Cyanophyta Counts and One-Week Ahead ANN Predicted Values for a) complete data set and b) validation data set.
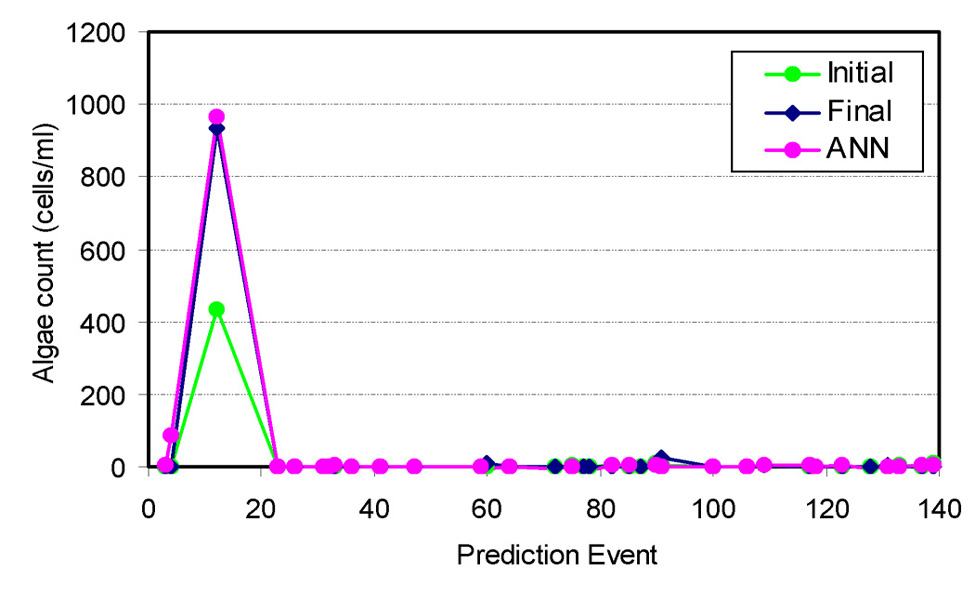
Figure 3. Time Series of Measured Cyanophyta Counts and One-Week Ahead ANN Predicted Values for a) complete data set and b) validation data set.
The AI classification models also achieved high forecasting performance. Three of the eight models that achieved 100 percent classification accuracy, while the lowest performing AI model classified 83 percent of the events into the correct range of algae counts. For the few cases where a class was misclassified, it always misclassified a class or range adjacent to the actual class.
Like many serious water problems, an AI-based modeling and real-time forecasting system can help avert algae bloom disasters like those summarized above in several important ways.
- It can provide decision makers with an advanced warning system that provides critical lead time to implement pro-active mitigation measures that may include treatment, switching to alternative water sources, and issuing health advisory warnings.
- It can help scientists and managers better understand the complex interplay of various weather, water quality, biological, and hydrologic factors, many of which will vary over space and/or time, which may be somewhat unique to their particular system. Through this knowledge, pro-active measures can be implemented that at least minimize if not eliminate some of the specific conditions that cause the algae blooms.
- It can provide value added to expensive data collection systems, and may even be used to optimize sampling strategies, potentially reducing costs.